Overview
This portfolio aims to document the contributions made by Teoh ZhiHui to the Personal Finance Tracker.
Personal Finance Tracker is a desktop finance tracker application used for tracking personal finances such as daily expenses, recurring expenses such as monthly electricity bills, budgets and debts owed to another party. The user interacts with it using a CLI, and it has a GUI created with JavaFX. It is written in Java, and has about 30 kLoC. The product was morphed from an Address Book over a period of 8 weeks under the constraints described here.
Summary of contributions
-
Major enhancement: added the Statistics feature
-
What it does: allows the users to generate useful information from their data.
-
Justification: This feature improves the product significantly because a user can now understand their spending habits at a glance
-
Highlights: This feature allows a user to see what percentage of their expenses are spent on a particular category. The user can also quickly see how often they are spending through the expense counts.
-
-
Code contributed: code collated by reposense]
-
Other contributions:
-
Project management:
-
Check pull requests done by group mates
-
Create issues for tracking in GitHub Issue Tracker
-
In charge of code in logic component
-
Implement parsers for commands
-
-
Documentation:
-
Enhancements to existing features:
-
Contributions to the User Guide
Given below are sections I contributed to the User Guide. They showcase my ability to write documentation targeting end-users. |
Viewing Statistics - Summary: stats
Produces statistics regarding the user’s finance.
The statistics include the frequency of entries, the total amount of money spent, and the percentage composition of the total.
The user may choose the time frame to be considered for the statistic by entering the start date and end date.
Table Example:
Category |
Amount Spent ($) |
Entry Count |
Percentage(%) |
FOOD |
302 |
38 |
13.12 |
TRANSPORT |
205 |
4 |
8.90 |
SHOPPING |
1702 |
8 |
73.96 |
WORK |
52 |
1 |
2.25 |
OTHERS |
40 |
1 |
1.92 |
Total |
2301 |
52 |
100 |
Format:
stats [sd/START_DATE] [ed/END_DATE]
|
Examples:
-
stats -
stats sd/12-02-2018 -
stats sd/01-01-2019 ed/01-02-2019
Viewing Statistics - Trend: statstrend
Produces statistics regarding the user’s finance over a period of time to show trends.
The statistics include the total amount of money spent on different categories and the frequency of entries in those categories.
The user must choose the time frame to be considered for the statistic by entering the start date and end date.
Table Example:
Amount ($):
Period Starting (M) |
01-01-2019 |
01-02-2019 |
01-03-2019 till End |
FOOD |
302 |
23 |
782 |
TRANSPORT |
123 |
0 |
140 |
SHOPPING |
324 |
0 |
$200 |
WORK |
0 |
401 |
0 |
TOTAL |
749 |
424 |
1122 |
Count:
Period Starting (M) |
01-01-2019 |
01-02-2019 |
01-03-2019 till End |
FOOD |
20 |
2 |
30 |
TRANSPORT |
2 |
0 |
3 |
SHOPPING |
3 |
0 |
1 |
WORK |
0 |
3 |
0 |
TOTAL |
25 |
5 |
34 |
Format: statstrend sd/START_DATE ed/END_DATE f/FREQUENCY
|
Examples:
-
statstrend sd/01-01-2018 ed/01-01-2019 f/M -
statstrend sd/01-01-2018 ed/01-02-2018 f/W
Viewing Statistics - Compare: statscompare
Produces and displays statistics regarding the user’s finance for 2 time periods.
The statistics include the total amount of money spent on different categories, the frequency of entries, and the percentage composition of the total.
The user must specify 2 time periods by specifying the starting dates and the desired period length.
Table Example:
From: 01-01-2020 To: 01-01-2021
Category |
Amount Spent ($) |
Entrie Count |
Percentage(%) |
FOOD |
302 |
38 |
13.12 |
TRANSPORT |
205 |
4 |
8.90 |
SHOPPING |
1702 |
8 |
73.96 |
WORK |
52 |
1 |
2.25 |
OTHERS |
40 |
1 |
1.92 |
Total |
2301 |
52 |
100 |
From: 02-02-2019 To: 02-02-2020
Category |
Amount Spent ($) |
Entrie Count |
Percentage(%) |
FOOD |
508 |
20 |
27.16 |
TRANSPORT |
722 |
8 |
30.88 |
SHOPPING |
1003 |
32 |
42.89 |
WORK |
85 |
2 |
3.63 |
OTHERS |
20 |
1 |
0.85 |
Total |
2338 |
63 |
100 |
Format: statscompare sd1/START_DATE_1 sd2/START_DATE_2 f/FREQUENCY
|
Examples:
-
statscompare sd1/01-01-2019 sd2/01-02-2019 f/M -
statscompare sd1/01-01-2018 sd2/01-01-2018 f/D
Contributions to the Developer Guide
Given below are sections I contributed to the Developer Guide. They showcase my ability to write technical documentation and the technical depth of my contributions to the project. |
Statistics Feature
This feature allows users to calculate various statistics for the entries in their Financial Tracker. The feature will read the expenses, debts and budgets and generate various metrics to display.
The Statistic feature consists of stats, statstrend and statscompare
This implementation is under Logic and Model components.
stats
Current implementation
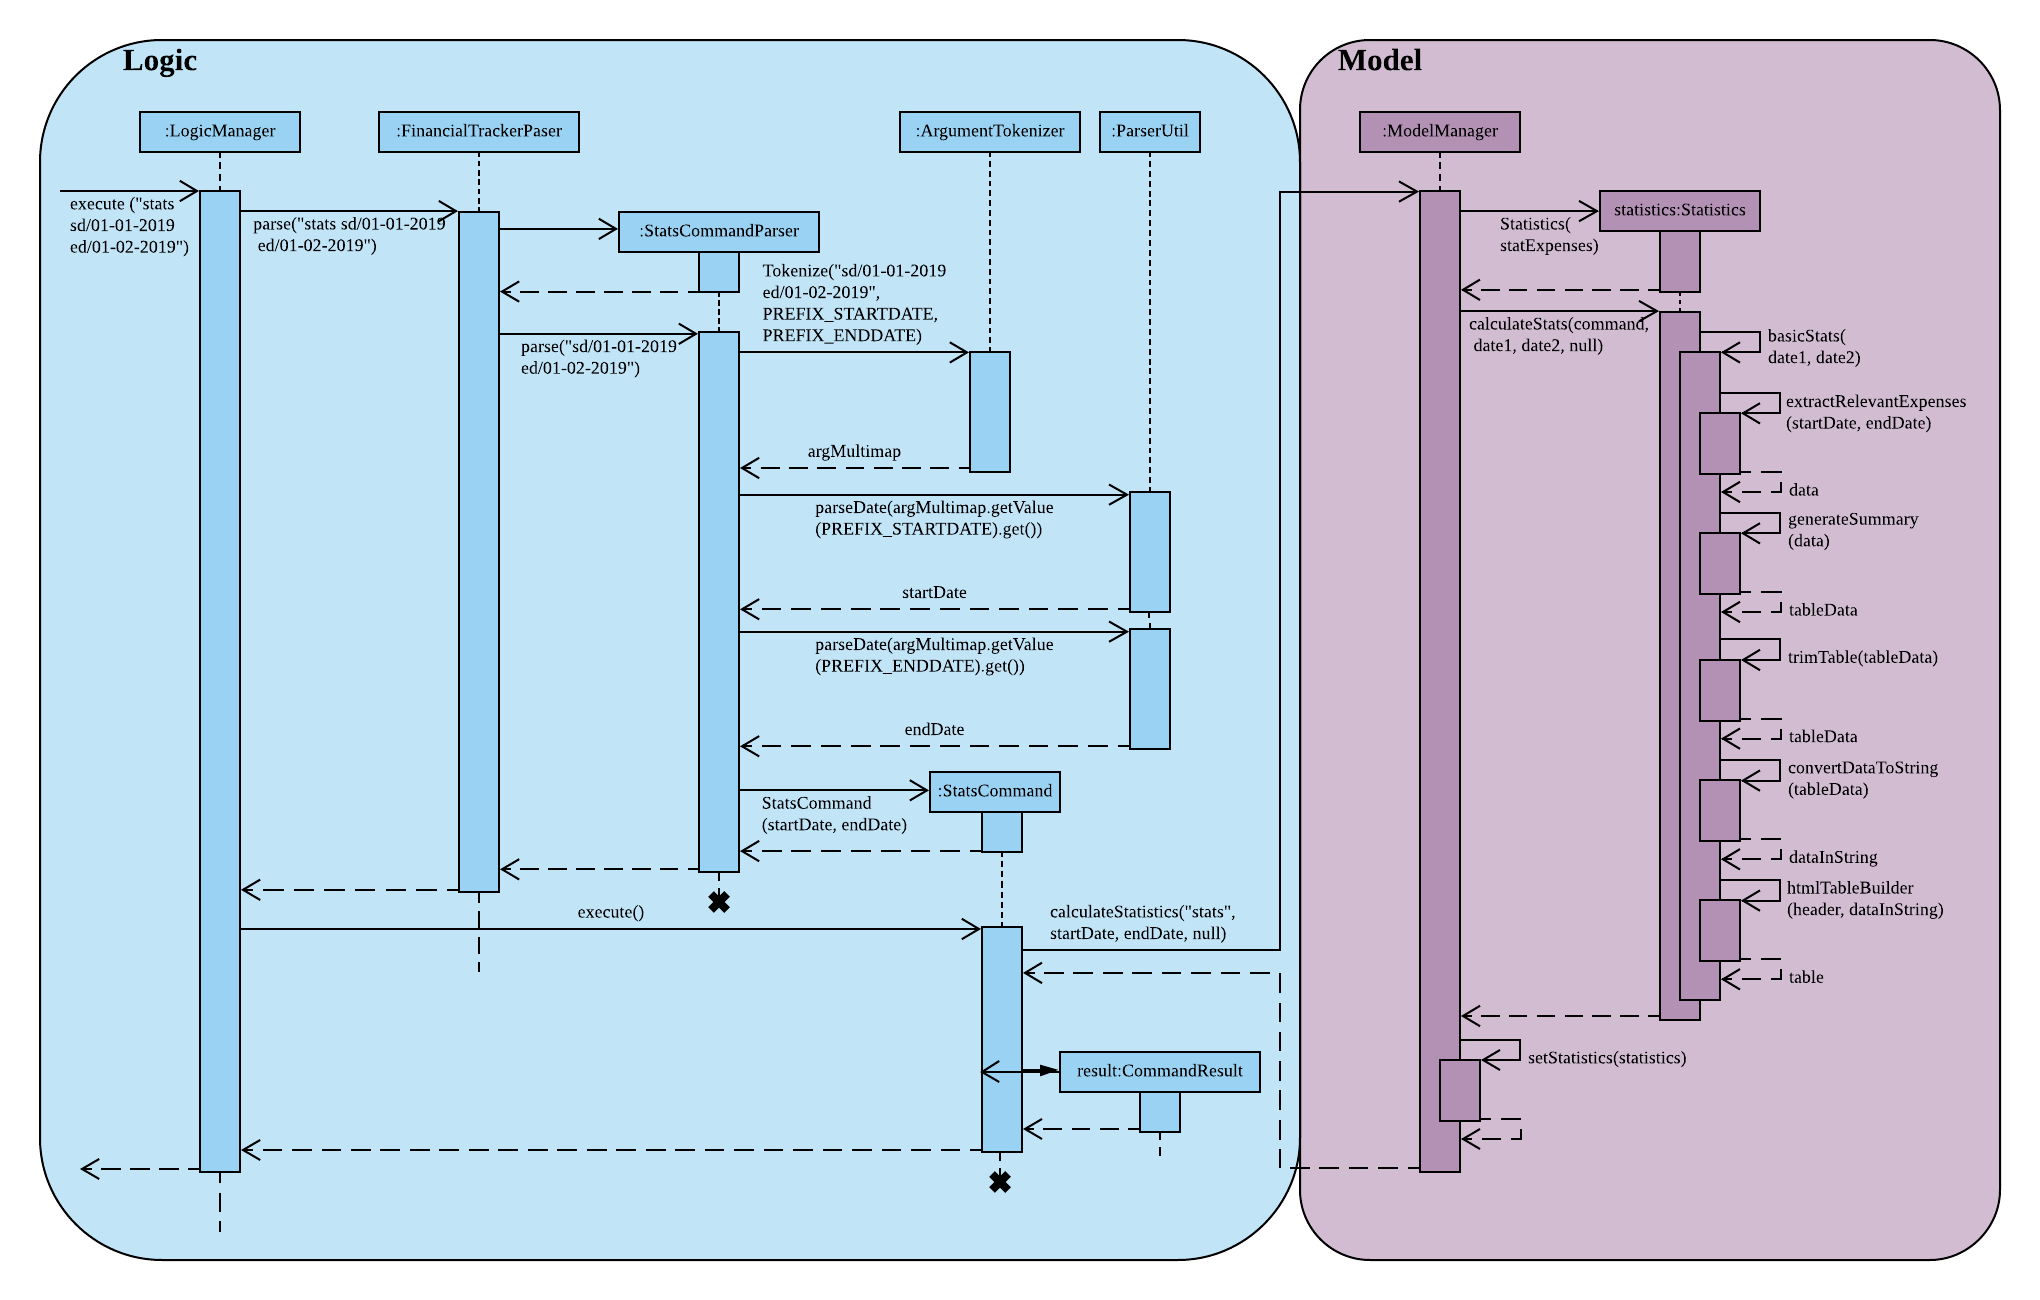
Below is the UML sequence diagram and a step-by-step explanation of an example usage scenario for stats.
-
User enters command
stats sd/01-01-2019. The command is received byFinanceTrackerParser, which then creates aStatsCommandParserobject. The created object then callsStatsCommandParser.parse("stats sd/01-01-2019")method. AStatsCommandobject is then created withStatsCommand(01-01-2019, 01-02-2019)and returned to theLogicManager -
Logic Managerwill call theexecutemethod of theStatsCommandobject which calls thecalculateStatistics("stats', 01-01-2019, 01-02-2019, null)method inModel. TheModel Managerwill handle this command and duplicate theExpenselist held in the Financial Tracker, creating a snapshot. TheModel Managerwill instantiate aStatisticsobject and call thecalculateStatistics("stats', 01-01-2019, 01-02-2019, null)method. -
The
calculateStatisticsmethod inStatisticsis a wrapper that will call the appropriate methodbasicStats(01-01-2019, 01-02-2019)after reading the String"stats"that was passed in. -
basicStatscalls the methodextractRelevantExpense(01-01-2019, 01-02-2019)which takes only theExpensesthat lie within the time range and adds them to a newExpenselistdata. These relevantExpensesare then processed by thegenerateSummary(data)method. This method will return a table of relevant statistics. -
The methods
trimTable(table),convertDataToString(trimmedtable)are called to process this table.htmlTableBuilder(header, table)is called to generate the HTML code required to show the Statistics in the BrowserPanel. -
Model ManagercallssetStatistics(statistics)which sets the observableStatisticsinModelManager. -
The listener in
BrowserPanelwill detect the change and display the HTML page showing the statistics
Future Implementation
Users will be given the option to choose a Visual Representation method. This will determine the output format of the statistics. Currently, statistics can only be displayed in table format. However, in the future a feature will be implemented to show the statistics in graphical or pictorial formats. These could include pie charts, bar charts, line graphs, etc.